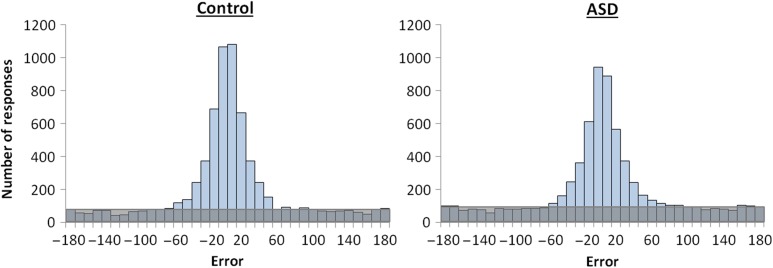
Figure 2.
Error distributions across all participants (and all features) within the control and the ASD groups. The number of responses that are distributed uniformly from −180 to 180° (shaded area) is indicative of increased guessing (and lower retrieval success rate) in the ASD group, but the concentration parameter k (describing the response variability) of the von Mises component is similar across the 2 groups.

