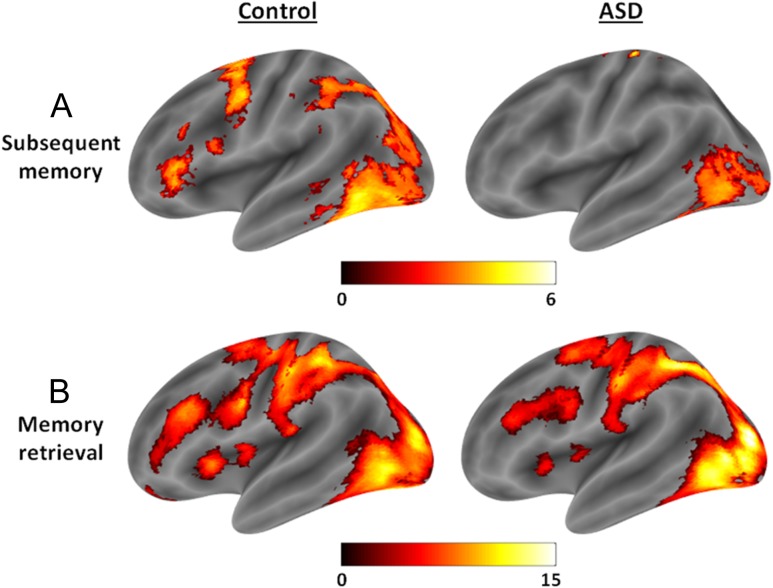
Figure 3.
(A) Subsequent memory effects in the control and ASD groups, where the ASD group shows an attenuated relationship between LPFC activity and subsequent retrieval success (0–6 features recalled). (B) Activity during the memory retrieval task, where the ASD group shows attenuated LPFC activity relative to the control group. Effects are displayed using bspmviewer at a threshold of P < 0.01 uncorrected for visualization, with the scale reflecting t values.

