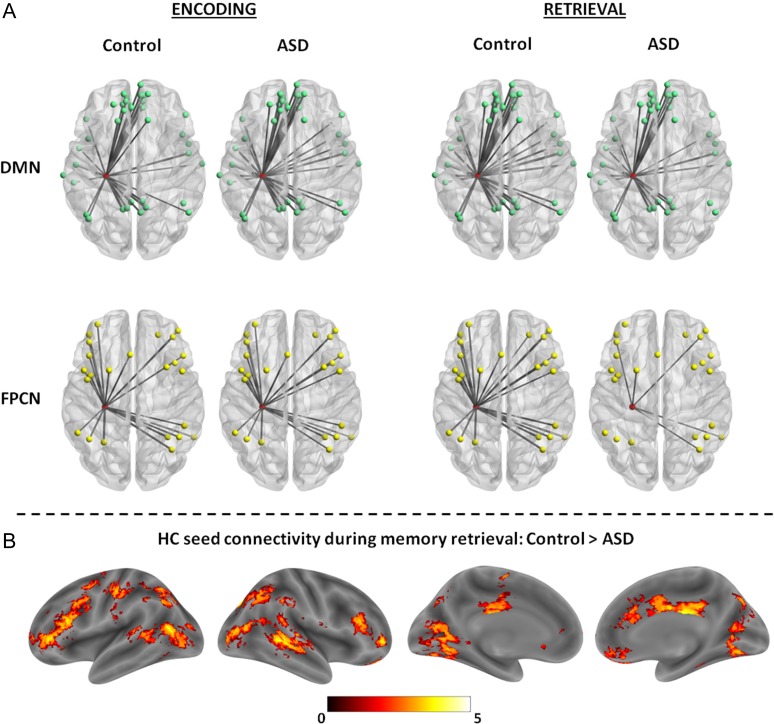
Figure 5.
(A) Images depict connections (mean r > 0.25), with the width of the connection lines weighted by the mean correlation strength, between the HC (node in red) and the DMN (top) and FPCN (bottom) nodes during the memory encoding and retrieval tasks in both the ASD and control groups. The connections between the HC node and the network nodes illustrate the similarity in connectivity during memory encoding but a reduction in HC-network connectivity during memory retrieval in the ASD group, with substantial reductions in connectivity between the HC and FPCN. Images were generated using BrainNet Viewer. (B) Regions showing significantly higher HC connectivity in the control group compared with the ASD group during memory retrieval. Effects are displayed using bspmviewer at a threshold of P < 0.01 uncorrected for visualization, with the scale reflecting t values.

