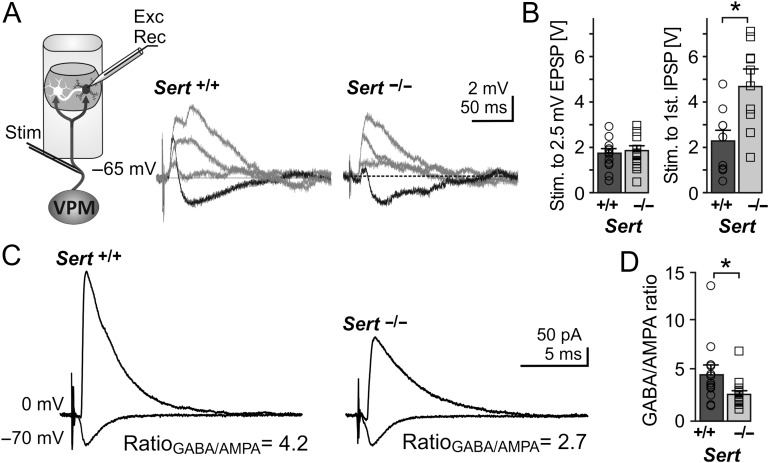
Figure 1.
Sert−/− rats show reduced FFI onto LIV excitatory neurons (A) Left, schematic of the recording depicting bipolar stimulation in the TCAs originating from the VPM with whole cell recording of a monosynaptic excitatory input and disynaptic inhibitory input onto an excitatory neuron within a LIV barrel. Middle, example current clamp recording showing input onto a LIV excitatory neuron following TCA stimulation with increasing stimulation strength (response to strongest stimulation resulting is given in black). Strongest stimulation resulted in truncation of the EPSP by disynaptic IPSP in both Sert+/+ and Sert−/−. (B) Histograms showing the TCA stimulation strength (as voltage pulses) needed to evoke an EPSP of 2.5 mV (left, Sert+/+: n = 1, Sert−/−: n = 14) and strength needed to induce the first IPSP (right, Sert+/+: n = 10, Sert−/−: n = 13) LIV excitatory neurons. (C) Representative voltage clamp recordings depicting approximate mean of Sert+/+ and Sert−/− GABA currents at Vh = 0 mV and AMPA currents at Vh = −70 mV. (D) Histogram of mean GABA/AMPA ratio of Sert+/+ (n = 13) and Sert−/− (n = 17) rats recorded in voltage clamp. Data are represented as mean ± SEM, *P < 0.05 (t-test).

