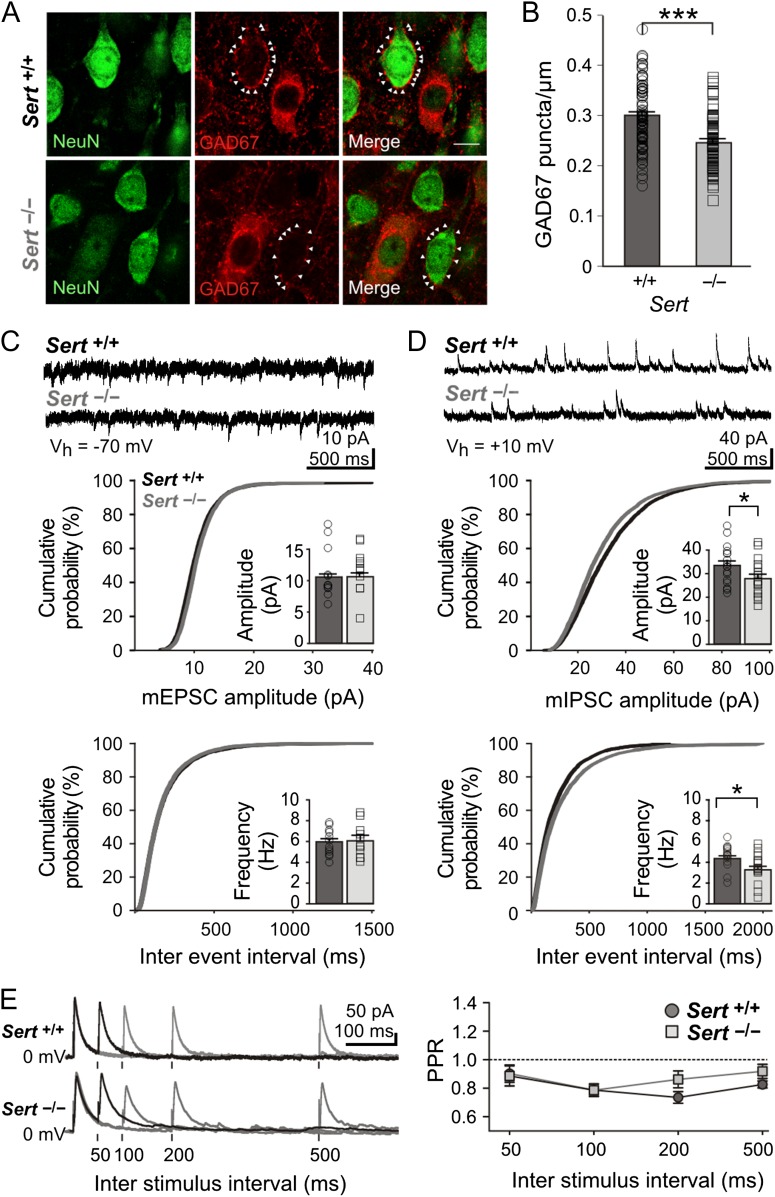
Figure 4.
Sert−/− rats show a reduced number of perisomatic inhibitory boutons onto excitatory LIV neurons. (A) Fluorescent photomicrographs of LIV excitatory neurons (NeuN+/Gad67−) used for quantification of perisomatic GAD67 puncta/µm in Sert+/+ and Sert−/− rats. White arrows mark puncta onto a representative soma of a pyramidal cell. (B) The number of GAD67-positive perisomatic varicosities was normalized against the diameter of each presumed excitatory neuron. Histogram shows the plot of mean number of perisomatic boutons per cell (normalized to cell diameter, puncta/µm) in Sert+/+ (n = 82) and Sert−/− (n = 91) neurons. (C) Top, example voltage clamp trace of mEPSCs recorded in excitatory LIV neurons of both Sert+/+ and Sert−/− rats at Vh = −70 mV. Bottom, cumulative probability distributions and histograms of amplitude and frequency of mEPSCs in Sert+/+ (n = 12) and Sert−/− (n = 11). (D) Top, example voltage clamp trace of mIPSCs recorded in excitatory LIV neurons of both Sert+/+ and Sert−/− rats at Vh = +10 mV. Bottom, cumulative probability distributions and histograms of amplitude and frequency of mIPSCs in Sert+/+ (n = 17) and Sert−/− rats (n = 16). (E) Left, example voltage clamp trace of evoked IPSCs onto LIV excitatory neurons within a barrel at different ISI (50, 100, 200, and 500 ms) at Vh = +10 mV in the presence of AMPA/NMDA blockers. Right, line plot depicting PPR Amp2/Amp1 at varying ISIs in Sert+/+ (n = 8) and Sert−/− rats (n = 9). Data are represented as mean ± SEM, *P < 0.05 and ***P < 0.001 (t-test).

