Fig. 1.

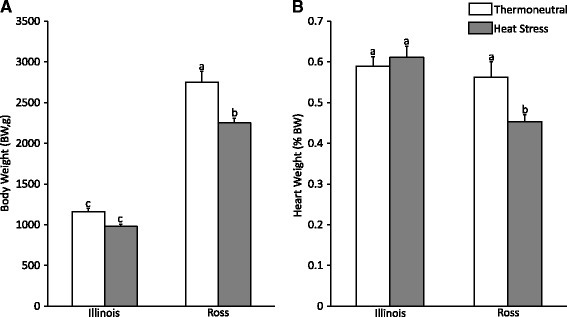
Body weight (a) and normalized heart weight (b) of two broiler lines under thermoneutral and heat stress conditions. Each bar represents Mean ± SEM. Different letters (a–c) indicate significant differences among different groups

Body weight (a) and normalized heart weight (b) of two broiler lines under thermoneutral and heat stress conditions. Each bar represents Mean ± SEM. Different letters (a–c) indicate significant differences among different groups