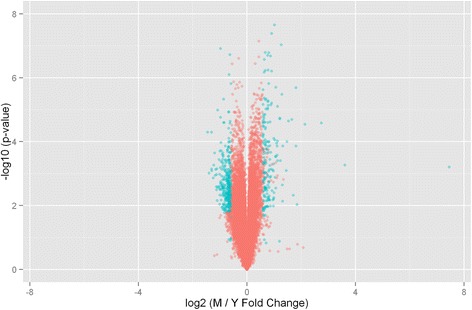
Fig. 1.

Transcript expression ratio’s in middle-aged compared to young LSC. The mRNA transcript expression in the LSC of 3 month and 17-month-old Fisher 344 male rats were assessed and 21,700 probe sets were measureable. The horizontal axis indicates the log2 ratios of middle aged over young expression and the vertical axis is the –log10 of the FDR corrected p values. ~ 1100 transcripts were differentially expressed. Blue dots represent genes that increased or decreased by at least 1.5 fold (528)
