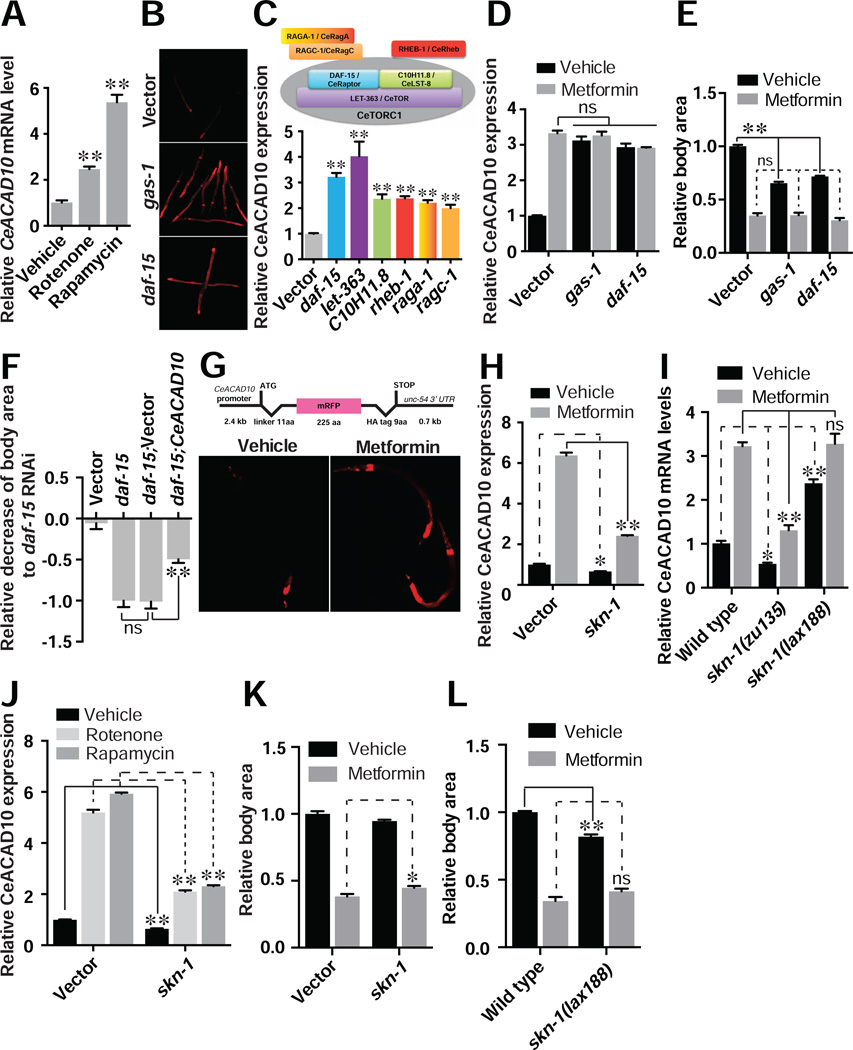
Figure 2. CeACAD10 Is Induced by Inhibition of Mitochondria or CeTORC1.
(A) CeACAD10 mRNA was measured following chemical inactivation of mitochondrial complex I and CeTORC1 with rotenone (5 µM) and rapamycin (100 µM), respectively. n = 3 biological replicates; **p < 0.01, by one-way ANOVA.
(B) Genetic deficiencies of mitochondria (gas-1) and CeTORC1 (daf-15) by RNAi lead to CeACAD10 reporter induction.
(C) RNAi to the indicated CeTORC1 components and its regulators upregulates CeACAD10 reporter expression. The bar graph is color-matched with the components indicated in the illustration. n = 3 biological replicates; **p < 0.01, by one-way ANOVA.
(D) Metformin treatment (50 mM) and RNAi to gas-1 or daf-15 have no additive effect on CeACAD10 reporter induction. n = 3 biological replicates; **p < 0.01, by two-way ANOVA.
(E) RNAi of gas-1 and daf-15 decreases body size of C. elegans and has no additive effect with metformin co-treatment (100 mM). n = 37–64; **p < 0.01 and non significant (ns), by two-way ANOVA.
(F) CeACAD10 RNAi suppresses the effect of CeTORC1 deficiency on body size reduction by daf-15 RNAi (see Figure S2B for knockdown efficiencies). Data are presented as a fraction mean of the body size reduction by daf-15 RNAi ± SEM. n = 27–44; **p < 0.01 and no significance (ns), by two-way ANOVA.
(G) Sequences of the CeACAD10 promoter reporter (top) are sufficient to confer induction by metformin (bottom). The promoter reporter is only used in this figure.
(H) RNAi of skn-1 partially suppresses CeACAD10 expression and the effects of metformin on CeACAD10 induction. n = 3 biological replicates; *p < 0.05 and **p < 0.01, by two-way ANOVA.
(I) Null mutants in skn-1(zu135) partially suppress CeACAD10 baseline and metformin-induced mRNA expression. Basal CeACAD10 mRNA is increased in gain-of-function skn-1(lax188) mutants. n = 3 biological replicates; *p < 0.05, **p < 0.01 and no significance (ns), by two-way ANOVA.
(J) RNAi of skn-1 partially suppresses the effects of 50 mM metformin, 5 µM rotenone and 100 µM rapamycin on CeACAD10 expression. n = 3 biological replicates; **p < 0.01, by two-way ANOVA.
(K) Effect of skn-1 RNAi on 100 mM metformin-induced growth suppression. n = 3 biological replicates; *p < 0.05, by two-way ANOVA.
(L) skn-1 gain-of-function mutants show decreased body size and no change in metformin (100 mM)-induced body size reduction. n = 3 biological replicates; **p < 0.01 and no significance (ns), by two-way ANOVA.
For (E and F) and (K and L), n= 29–36 animals. All bars indicate means and SEM.

