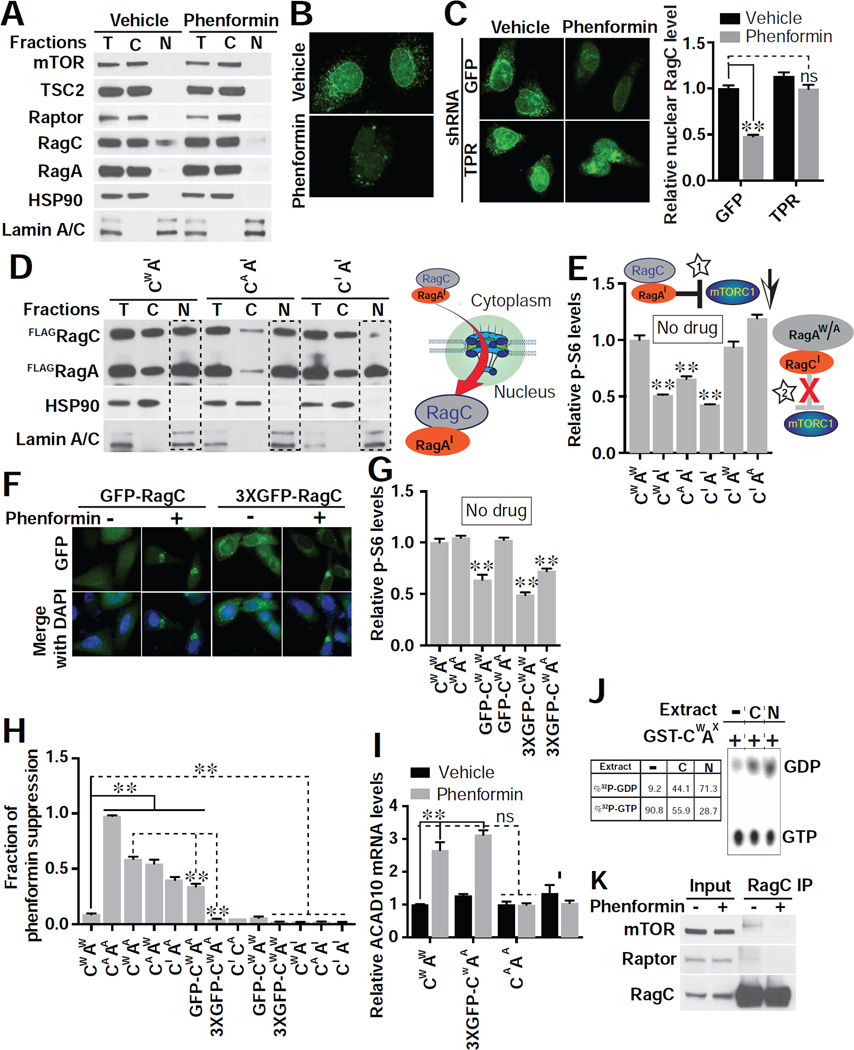
Figure 6. Phenformin Inhibits mTORC1 through Nuclear Exclusion of RagC GTPase.
(A) Subcellular localization of endogenous mTORC1 pathway components post phenformin (1 mM) treatment in HEK293E cells. Equal amounts of protein from each fraction were loaded (T, total lysate; C, cytosol fraction; N, nuclear fraction). Hsp90 specifically marks the cytosolic fraction, and Lamin A/C the nuclear fraction. Blots shown are representative of two biological replicates.
(B) Nuclear RagC is excluded by phenformin (1mM), assessed by immunofluorescence in HeLa cells. Images are representative of 3 biological replicates. Scale bar, 10 µm.
(C) RNAi to TPR allows RagC to enter the nucleus with or without phenformin treatment (1 mM). Nuclear RagC was quantified with ImageJ (right). Images are representative of 2 biological replicates. Scale bar, 10 µm. n = 17 cells quantified for GFP/vehicle, 14 for GFP/phenformin, 16 for TPR/vehicle, and 12 for TPR/phenformin; **p < 0.01 and no significance (ns), by two-way ANOVA.
(D) Overexpression of inactive RagA (AI) drives RagC in wild type (CW), activated (CA), or inactive (CI) form to the nucleus in HEK293E cells (see Methods for molecular identity of mutants). A schematic model indicating that RagAI is the stimulus for RagC nuclear entry is shown. Blots shown are representative of three biological replicates.
(E) Overexpression of RagAI acts as a dominant negative inhibitor of mTORC1. HEK293E cells were transfected with the indicated combination of RagA (AW, wild type; AI, inactive; AA, active) and RagC (CW, wild type; CI, inactive; CA, active), and mTORC1 activity assessed (p-S6/total S6). A cartoon is shown of RagAI-RagC inhibiting mTORC1 (star 1) but not RagA-RagCI (star 2). n = 3 biological replicates; **p < 0.01, by one-way ANOVA.
(F) Expression of RagC fused to one (GFP-RagC) or three (3xGFP-RagC) GFP molecules leads to pronounced nuclear exclusion upon treatment with phenformin (1 mM). Images (GFP in green and DAPI in blue) are representative cells from 3 biological replicates.
(G) mTORC1 activity (p-S6/total S6) is reduced by adding bulky GFP modifications to RagC as in (F). No biguanide treatment was used. n = 3 biological replicates; **p < 0.01, by one-way ANOVA.
(H) Suppression of phenformin effect on mTORC1 activity (p-S6/total S6) by different combinations of RagA and RagC was assessed after treating transfected HEK293E cells with 1 mM phenformin as in (F). n = 3 biological replicates; **p < 0.01, by one-way ANOVA.
(I) Overexpression of activated RagAA/RagCA but not RagAA/3xGFP-RagC fully suppresses the induction of ACAD10 mRNA evident with 1 mM phenformin in HEK293E cells. **p < 0.01, by one-way ANOVA.
(J) Nuclear GTPase-activating protein (GAP) activity is present towards RagC. GST-RagCW/RagAX was incubated with buffer (lane 1), total cytoplasmic (C, lane 2) or nuclear (N, lane 3) lysates.
(K) RagC from phenformin (1 mM) treated HEK293E cells fails to associate with mTORC1 indicated by co-IP analysis. Blots shown are representative of two biological replicates.

