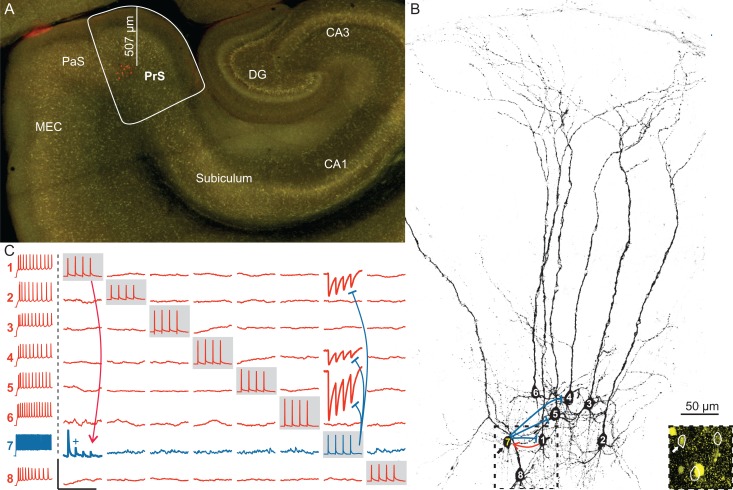
Figure 1.
Multiple simultaneous whole-cell recordings in the presubiculum. (A) Low-power VGAT-YFP-fluorescent image showing an overview of a horizontal hippocampal slice with the dentate gyrus (DG), the CA3, CA1 areas and the subiculum, as well as the parahippocampal region including the presubiculum (PrS), the parasubiculum (PaS), and the MEC. Eight cells in the PrS were recorded simultaneously and filled with biocytin (red). Their depth measured from the pial surface along the dendritic axis is shown by the distance bar (570 µm). (B) High-power projected image of a confocal stack of the biocytin-filled cells in panel (A). PCs are numbered in white, one IN in yellow (7). Inset: confocal image corresponding to the dashed box illustrating the YFP-positive cell body of the IN (arrow). (C) Averaged current-clamp traces of the 8 neurons shown in panels (A) and (B) revealed 4 synaptic connections out of the total 56 tested possible connections. The firing pattern of each cell is shown in the left column, PCs in red and the IN in blue. Traces recorded from one neuron are represented in one row, simultaneously recorded traces from all neurons are shown in a single column. While a single neuron was activated by eliciting a train of 4 APs (gray boxes), the postsynaptic responses were monitored in the other neurons. The excitatory connection onto the IN is indicated by a red line, inhibition of PCs by blue lines. Scale bars: horizontal 250 ms, vertical 100 mV for APs, 1 mV for postsynaptic traces (vertical scale bar for EPSP with + is 5 mV).

