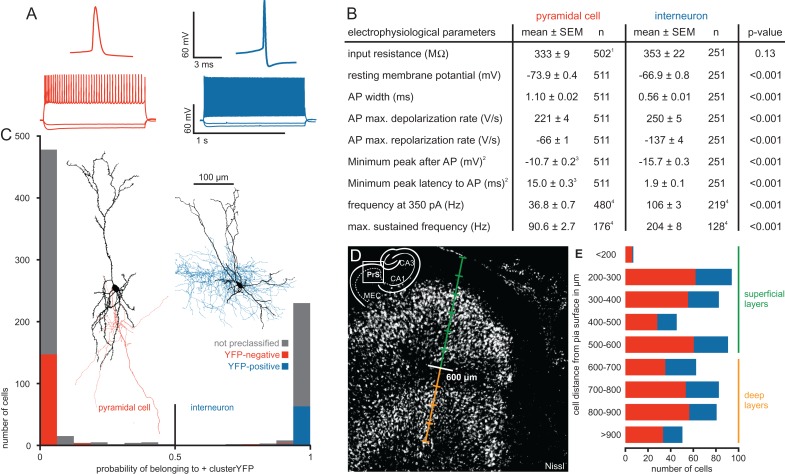
Figure 2.
Electrophysiological properties and morphology of pyramidal cells and interneurons in the presubiculum. (A) Representative AP traces and firing patterns of the 2 cell types. (B) Table of electrophysiological parameters for each cell type including P values from statistical comparison using Mann–Whitney U Test. 1For 9 PCs, the input resistance was not determined. 2We used the minimum potential in a time window of 20 ms following the AP and its latency as a simplified measurement to detect a possible fast AHP. 3PCs mostly lacked a fast AHP, therefore their potentials and latencies were shifted to higher values confined by the 20 ms time window. 4Firing frequencies were determined in subsets of cells. (C) Histogram showing the probability of a cell belonging to the IN cluster calculated by the discriminant analysis. Red and blue bars represent cells with confirmed VGAT-YFP expression. Note the good separation of PCs and INs, the almost complete lack of VGAT-YFP expression in the PC cluster and its reliable expression in the IN cluster. Gray bars represent cells in which the YFP-expression was not rigorously determined. Cells with a probability higher than 0.5 were classified as INs, cells with a lower probability as PCs. Two representative samples of morphologically reconstructed cells are shown (PC with red axon, IN with blue axon). (D) An overview image of a Nissl-stained section of the presubiculum illustrates the separation between superficial layers (green) and deep layers (orange) at 600 µm, corresponding to the cell sparse layer IV. The scale bar indicates 100 µm steps. A schematic overview in the corner depicts the region relative to the hippocampus. (E) Number of recorded cells plotted against their depth measured from pia. IN in blue and PC in red. Lines indicate the distinction in superficial (green) and deep layers (orange).

