Figure 3.
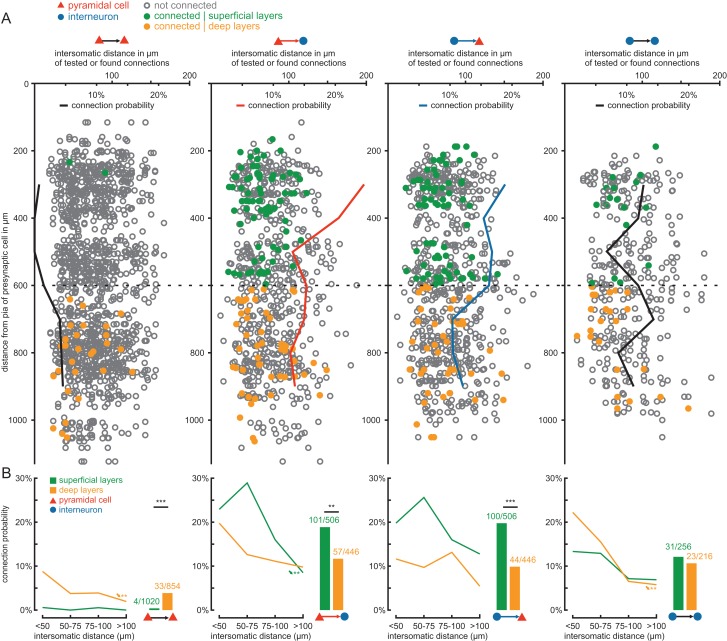
Layer-specific excitatory and inihibitory connectivity in presubicular circuits. (A) Of the total 4250 possible connections tested, exact positions of the pre- and postsynaptic cells were determined for 3160 tested connections. In the diagrams, each circle or dot represents a tested connection: a green dot indicates a detected synaptic connection in the superficial layers, an orange dot a connection in the deep layers, and the open gray circles depict tested connections without synaptic coupling. For each tested connection type, the depth of the presynaptic cell measured from the pial surface along the dendritic axis (vertical axis) was plotted against the intersomatic distance between the cells (values above horizontal axis). The black, red, and blue lines represent the connection probability of each synaptic type, calculated as the ratio of observed to tested connections (values below horizontal axis), plotted against the distance to pia (vertical axis) as a moving average of 2 values. The division between superficial and deep layers is shown as a dotted line at 600 µm. (B) The connection probability as a function of intersomatic distance in each layer is shown for the different synaptic groups. Asterisks with arrows depict statistically significant distance-dependent decrease of connection probability calculated using the Cochran-Armitage test, **P < 0.01. The adjacent bar graphs depict the pooled connection probability in the superficial (green bars) and deep layers (orange bars). Numbers indicate found and tested connections. Statistical comparisons between the layers were calculated using Fisher's exact test, **P < 0.01, ***P < 0.001.

