Figure 5.
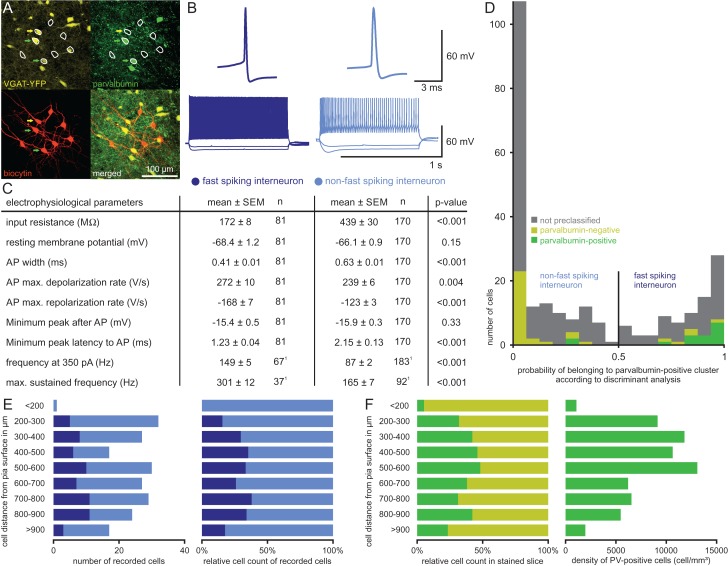
Classification of FS versus NFS interneurons. (A) Confocal images of slice with 8 recorded cells (white circles). Upper left: YFP-expression in yellow was found in 3 cells (arrows). Upper right: PV-immunostaining in green revealed 2 immunopositive cells (green arrow: PV-positive; yellow arrow: PV-negative). Lower left: Biocytin staining in red shows further 5 PCs without YFP- or PV-expression. Lower right: Overlay of all 3 channels. (B) Example AP traces and firing patterns of each IN class. (C) Table of electrophysiological parameters for the 2 IN classes. Statistical comparison for each parameter was performed using Mann–Whitney U test. 1Firing frequencies were determined for a subset of cells. (D) Histogram showing the probability of a cell belonging to the FS cluster calculated by the discriminant analysis. Colored bars represent 50 INs for which PV-expression was investigated (green bars: PV-positive; yellow bars: PV-negative), gray bars represent INs not stained for PV. Cells with a probability higher than 0.5 were classified as FS interneurons, cells with a lower probability as NFS interneurons. (E) Distribution of IN classes across the layers as classified based on electrophysiological properties. Left: Absolute numbers of INs classified as FS interneurons (dark blue bars) and NFS interneurons (light blue bars) plotted against their depth measured from the pia. Right: Proportion of the 2 classes of recorded INs plotted against their depth. (F) IN class distribution across the layers in immunohistochemically stained slices. Left: Proportion of PV-positive INs (green bars) and PV-negative INs (yellow bars) plotted against their depth. Right: Cell density of PV-positive INs plotted against their depth.

