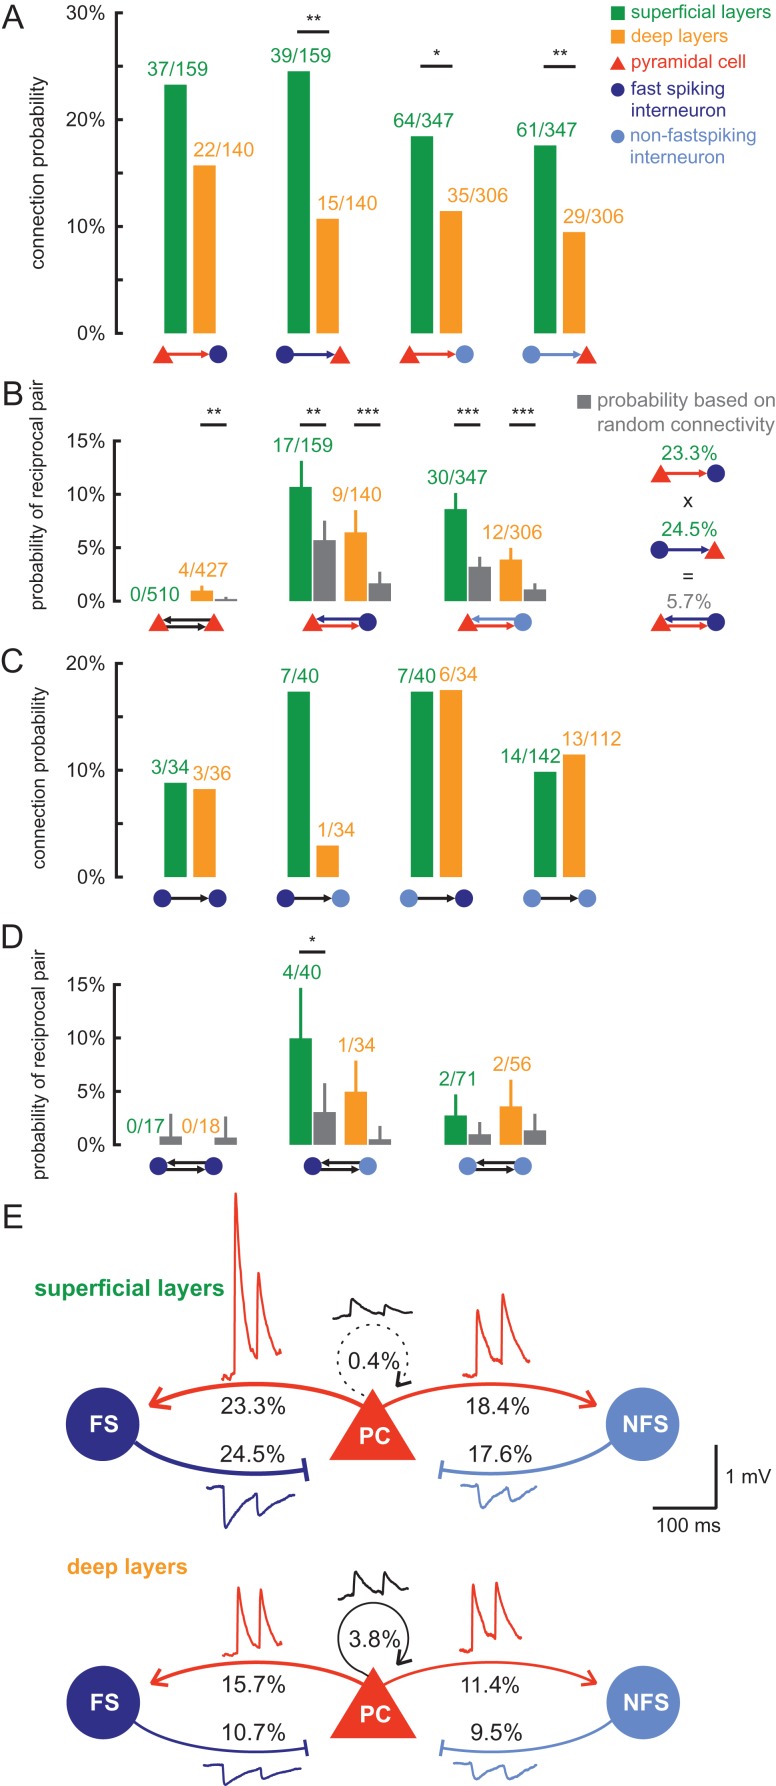
Figure 6.
Connectivity and reciprocity of interneuron subtypes. (A) Unidirectional connection probability for IN excitation and PC inhibition shown for different IN subtypes (dark blue: FS; light blue: NFS) and layers (green: superficial; orange: deep). Statistical comparisons between the layers were calculated using the Fisher's exact test, *P < 0.05, **P < 0.01, ***P < 0.001. (B) Observed probability of reciprocal pair in each layer (green and orange bars) compared with the expected reciprocal rate under the random assumption (gray bar). Error bars represent standard deviation assuming binomial distribution. Statistical difference was assessed using the binomial test, ***P < 0.001, **P < 0.01. Right: Example calculation for expected reciprocal rate under the assumption that unidirectional connections are independently established. (C) Unidirectional connection probability between INs for each subtype and layer. (D) Reciprocal rate between INs compared with the random probability as described in (C), *P < 0.05. (E) Schematic figure of the connection probabilities between the different cell types in the superficial and deep layers of the presubiculum. Transmission properties are represented by modified traces that depict the mean of the postsynaptic amplitude, PPR and half-width for each synaptic group.

