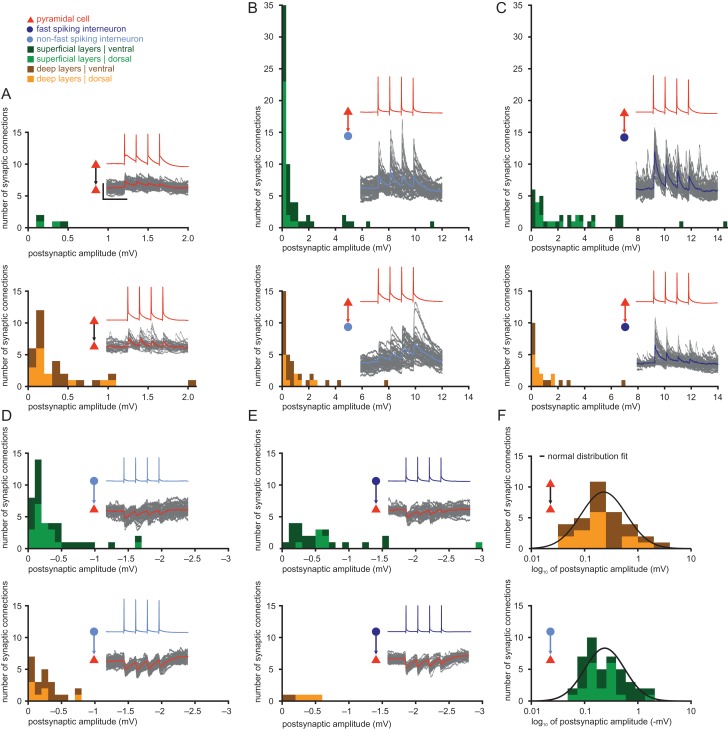
Figure 7.
Heavy-tailed distribution of synaptic amplitudes. The postsynaptic amplitude distributions are shown for different synaptic groups and both layers. Each histogram further distinguishes between ventral connections (dark green in superficial layers, brown in deep layers) and dorsal connections (light green in superficial layers, orange in deep layers). Example recording traces are shown for each group: the presynaptic APs are shown in the color of the presynaptic cell and the recorded postsynaptic traces are shown in gray, while the average trace is shown in the color of the postsynaptic cell. Scale bars: horizontal 100 ms, vertical 50 mV for APs, 1 mV for postsynaptic potentials. (A) PC–PC, bin size 0.1 mV. (B) PC–NFS, bin size 0.3 mV. (C) PC–FS, bin size 0.3 mV. (D) NFS–PC, bin size 0.1 mV. (E) FS–PC, bin size 0.1 mV. (F) Distributions of deep PC–PC and superficial NFS–PC amplitudes are shown on a logarithmic scale to illustrate log-normal features in excitatory and inhibitory connections. Black line represents the normal distribution fit for the sample.

