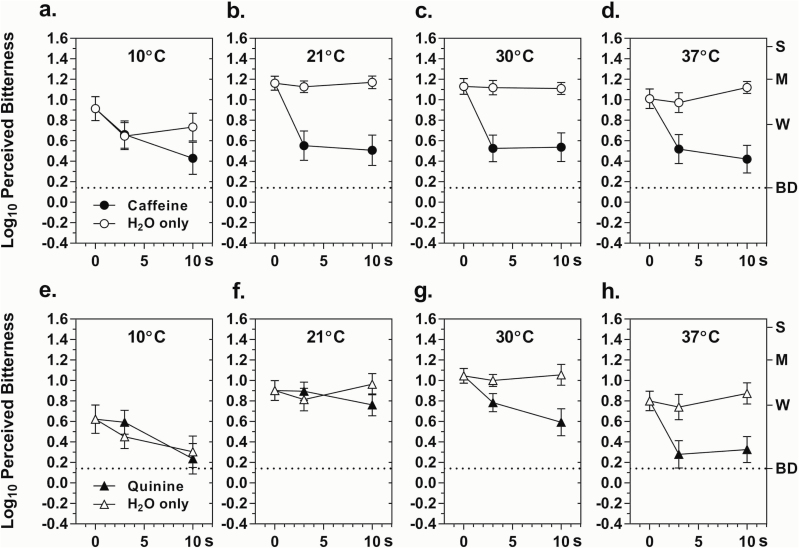
Figure 2.
Log10 mean ratings of bitterness intensity perceived for 3-s post-exposures to caffeine (a–d) or quinine (e–h) at temperatures of 10°–37 °C following 0-, 3-, or 10-s pre-exposures to caffeine or H2O (only) at the same temperatures. The data points at 0-s for each temperature are the same as those in Figure 1. Letters on the right y-axis represent semantic labels on the gLMS: BD = barely detectable, W = weak, M = moderate, S = strong. Vertical bars indicate SEMs.

