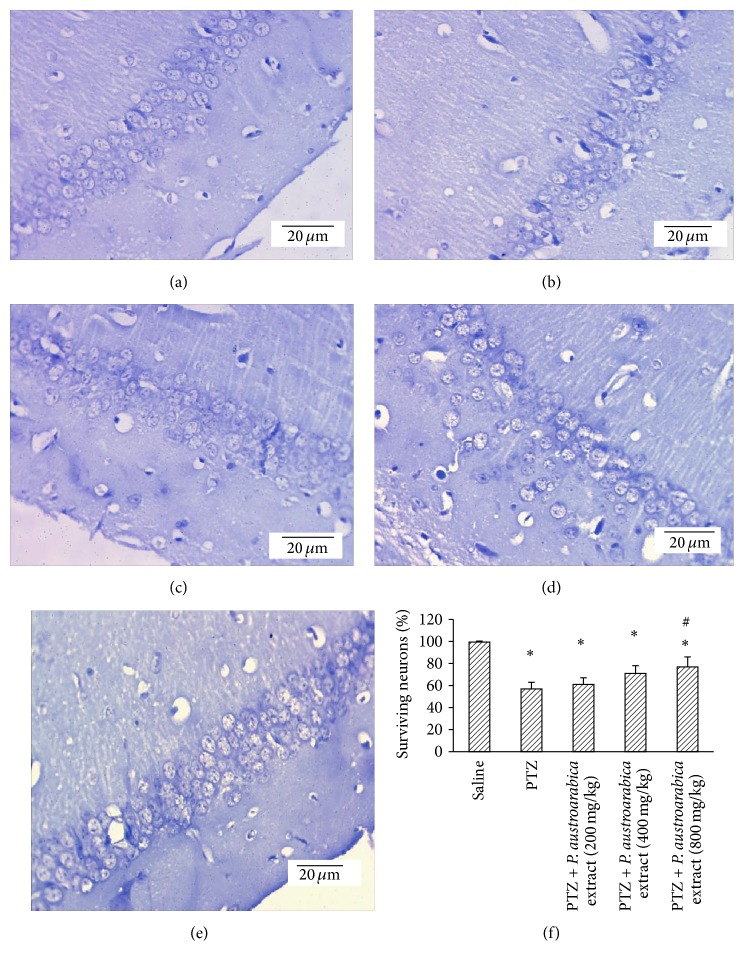
Figure 5.
Surviving neurons in cortex of the experimental groups. ((a)–(e)) Photographs for cortical sections from the experimental groups stained with Cresyl violet stain. (f) Mean percent of surviving neurons in the study groups. Mice were injected with PTZ (35 mg/kg) trice a week for a total of 13 injections. Cortices from formalin-fixed brains were cut and stained. Results are mean ± SEM and analyzed using one-way ANOVA followed by Bonferroni's post hoc test at P < 0.05. ∗Significant difference from saline group. #Significant difference from PTZ group.

