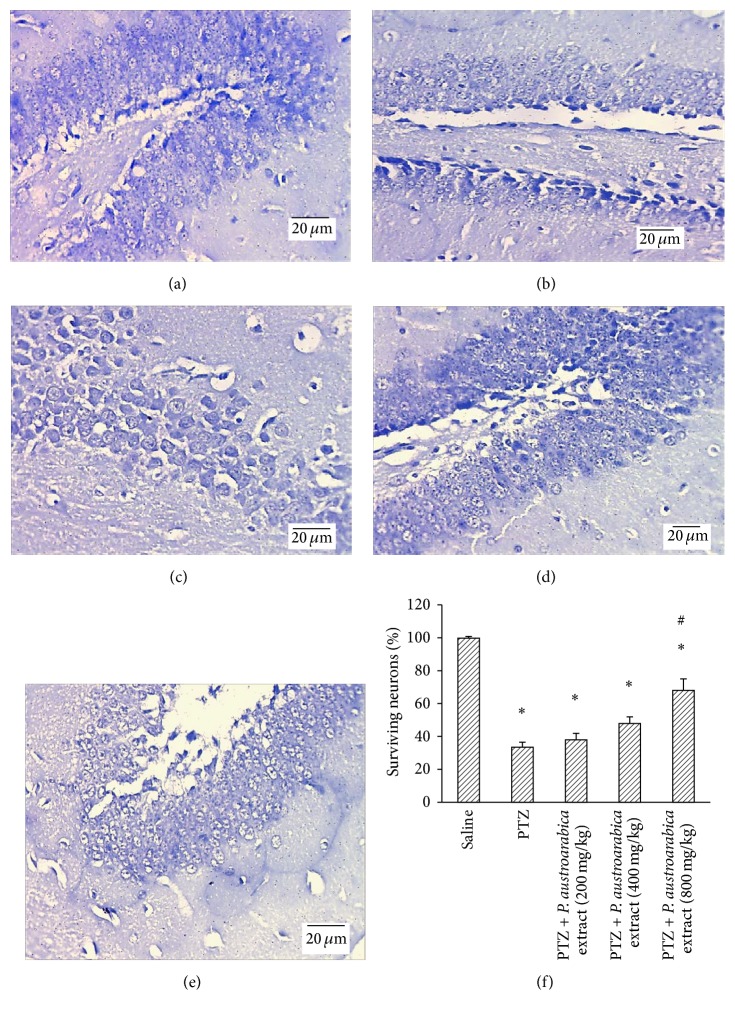
Figure 6.
Surviving neurons in hippocampus of the experimental groups. ((a)–(e)) Photographs for hippocampal sections from the experimental groups stained with Cresyl violet stain. (f) Mean percent of surviving neurons in the study groups. Results are mean ± SEM and analyzed using one-way ANOVA followed by Bonferroni's post hoc test at P < 0.05. ∗Significant difference from saline group. #Significant difference from PTZ group.

