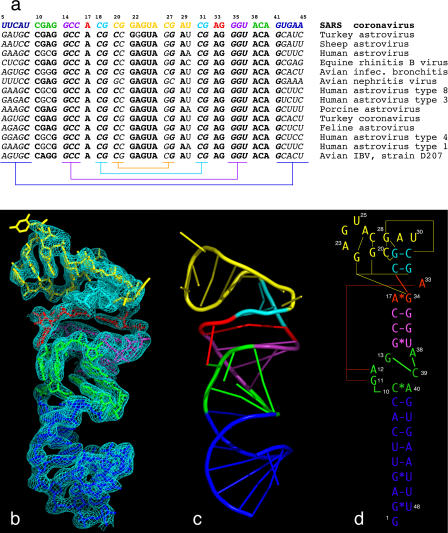
Figure 1. The Primary, Secondary, and Tertiary Structures of the SARS s2m RNA.
(A) Phylogenetic comparisons of s2m RNA sequences from various coronavirus and astrovirus species. The SARS RNA sequence is color-coded to match the color scheme used throughout. Conserved sequences are highlighted as bold letters, and co-varying sequences involved in conventional RNA helical base-pairing are indicated in italics. Sequence complements are indicated using color-coded brackets.
(B) The 2.7-Å experimental SIRAS platinum-phased and solvent-flattened electron density map contoured at 1.25 root mean square deviation. The map allowed unambiguous tracing of the RNA molecule because the density was unambiguous for all backbone atoms and all nucleotide bases except U(25), U(30), and U(48).
(C) A corresponding ribbon diagram highlighting the unusual fold.
(D) Schematic representation of the s2m RNA secondary structure, with tertiary structural interactions indicated as long-range contacts. The schematic diagram is designed to approximate the representation of the fold. The GNRA-like pentaloop structure is shown in yellow, A-form RNA helices are shown in blue and purple, the three-purine asymmetric bulge is in red, and the seven-nucleotide bubble is in green. Long-range tertiary contacts are indicated by thin red and yellow lines.

