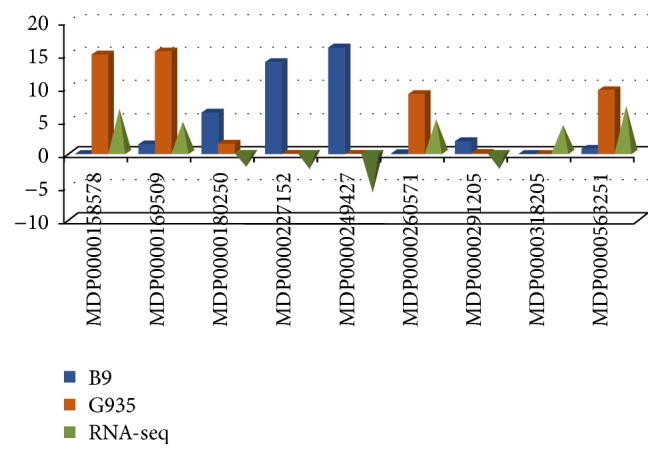
Figure 5.

Validation of differential expression patterns for selected DEGs by qRT-PCR. Validation of the expression patterns for selected DEGs using qRT-PCR. Gene reference numbers were shown on the x-axis; blue and red bars show the relative expression level in the roots of B.9 and G.935 from qRT-PCR experiment; the green pyramid indicates the values of Log2FC from RNA-seq data; the upward direction represents the higher transcript level in the roots of G.935 and downward direction indicates lower transcript level in G.935. Values on the y axis denote the relative expression level for qRT-PCR and the Log2FC values from RNA-seq data set.
