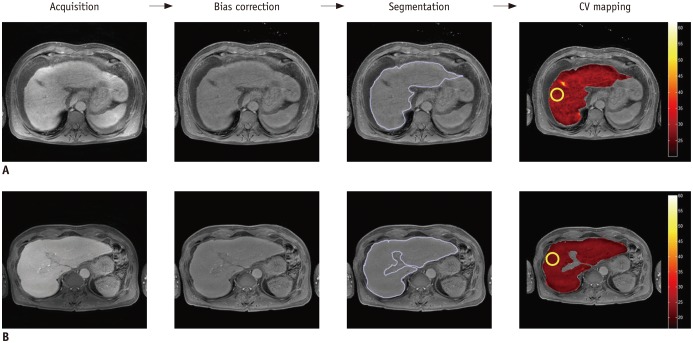
Fig. 1. Workflow for calculation of coefficients of variation (CV) in control subject (A) and in patient with chronic hepatitis B (B) in hepatobiliary phase of Gd-EOB-DTPA-enhanced MRI.
To measure hepatic fibrosis quantitatively, MATLAB-based software was used to calculate CV map. After acquisition of MR images, bias correction and segmentation of liver parenchyma were performed, and then mean value of CV map on region of interest at anterior segment of right lobe of liver was calculated. Gd-EOB-DTPA = gadolinium ethoxybenzyl diethylenetriaminepentaacetic acid or gadoxetic acid, MRI = magnetic resonance imaging

