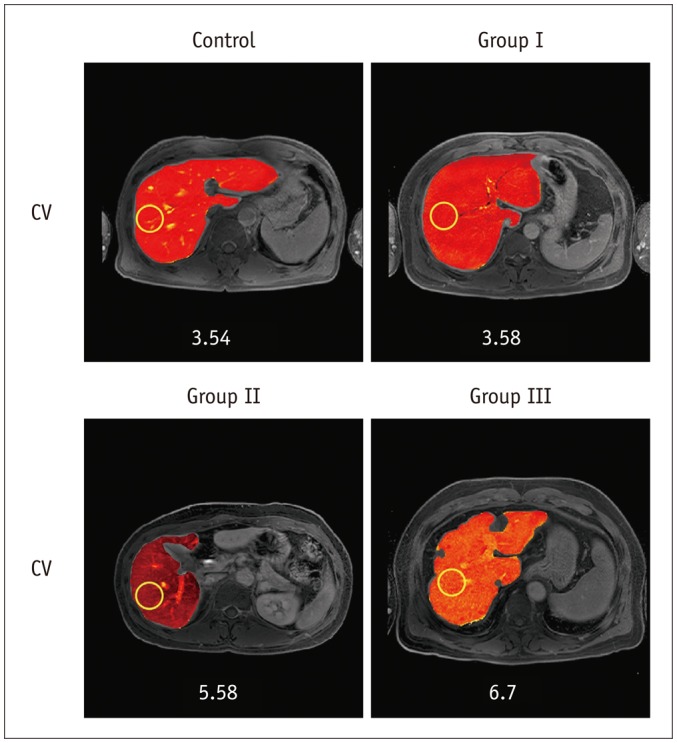
Fig. 2. Images show representative CV maps on control and patients with chronic hepatitis B of group I, II, and III on HB phases of Gd-EOB-DTPA-enhanced MRI.

CV values are 3.54, 3.58, 5.58, and 6.7 in HB phase, respectively. CV = coefficients of variation, Gd-EOB-DTPA = gadolinium ethoxybenzyl diethylenetriaminepentaacetic acid or gadoxetic acid, HB = hepatobiliary, MRI = magnetic resonance imaging
