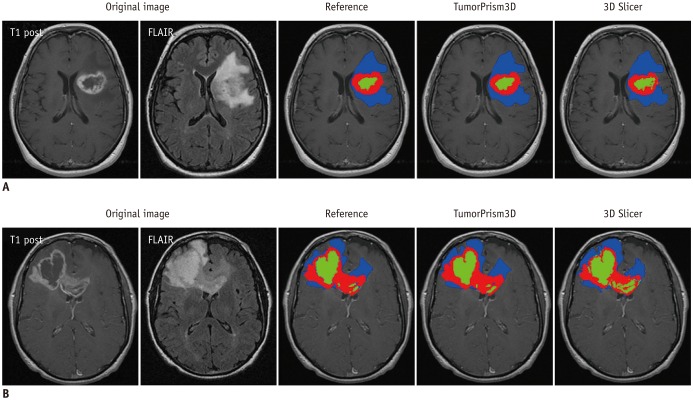
Fig. 4. Example of segmentation results with two semi-automated software tools.
Contrast-enhanced, necrotic, and non-enhancing T2 high signal intensity components are indicated by red, green, and blue color, respectively.
A. Represents case in which similar segmentation results were produced. B. Represents case in which difference was observed in segmentation results. FLAIR = fluid-attenuated inversion recovery

