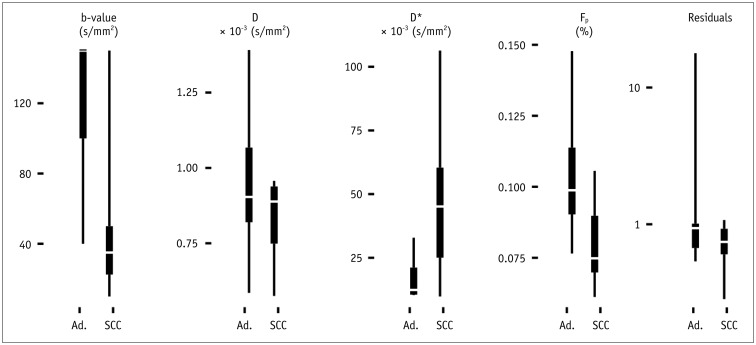
Fig. 3. Boxplot of optimal b-value thresholds (defined as yielding smallest sum of squared residuals to fit, which are depicted on far right as “residuals”) and IVIM parameters D, D*, and Fp of two examined histological cancer types adenocarcinoma (Ad.) and squamous cell carcinoma (SCC).
IVIM = intravoxel incoherent motion

