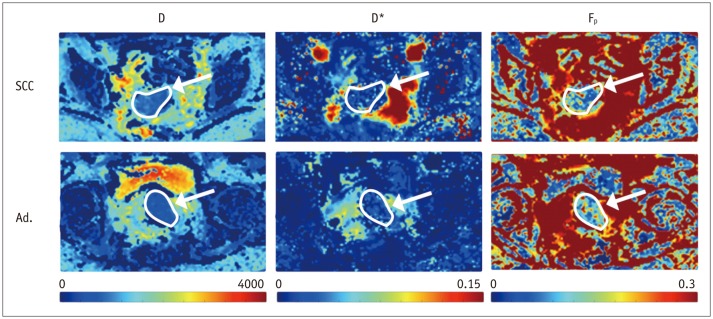
Fig. 4. Parametric maps depicting three IVIM parameters D, D*, and Fp in one case of squamous cell carcinoma (SCC) in top row, and adenocarcinoma (Ad.) in bottom row (both outlined and marked with white arrow).
Difference in Fp is subtle, but can be appreciated in right column with color scale set to maximum of 0.3 for this example. IVIM = intravoxel incoherent motion

