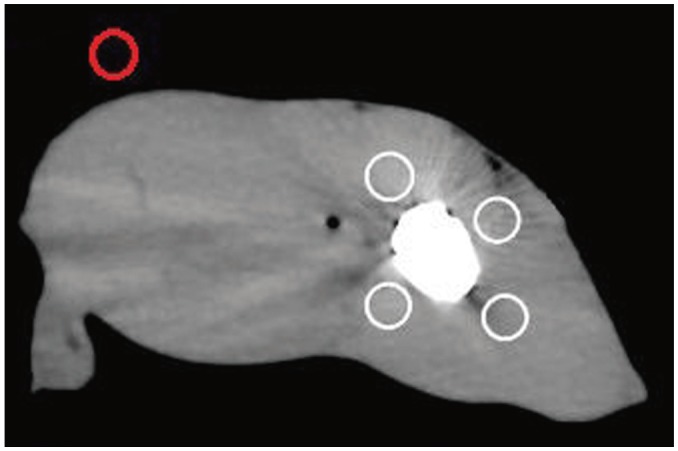
Fig. 3. Schematic of ROIs selection.

Four white circles showed ROIs drawn in muscular area around metal implants. Red circle was used for measurements in background region away from metal implants. ROIs = regions of interest

Four white circles showed ROIs drawn in muscular area around metal implants. Red circle was used for measurements in background region away from metal implants. ROIs = regions of interest