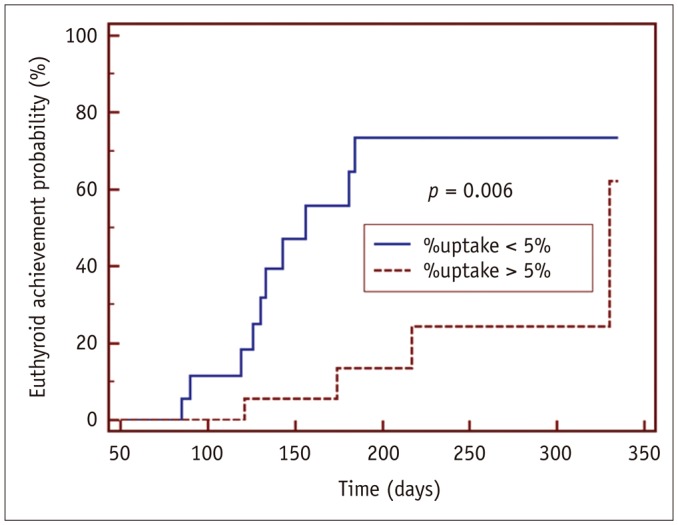
Fig. 2. Kaplan-Meier curve difference for achieving euthyroidism using %uptake cutoff of 5.0%.

Patients with rapid responses (n = 18) had lower mean %uptake (2.6 ± 1.2%) than those with slow responses (n = 18, 11.3 ± 6.5%). Time to euthyroidism differed significantly between two groups (p = 0.006, log-rank test).
