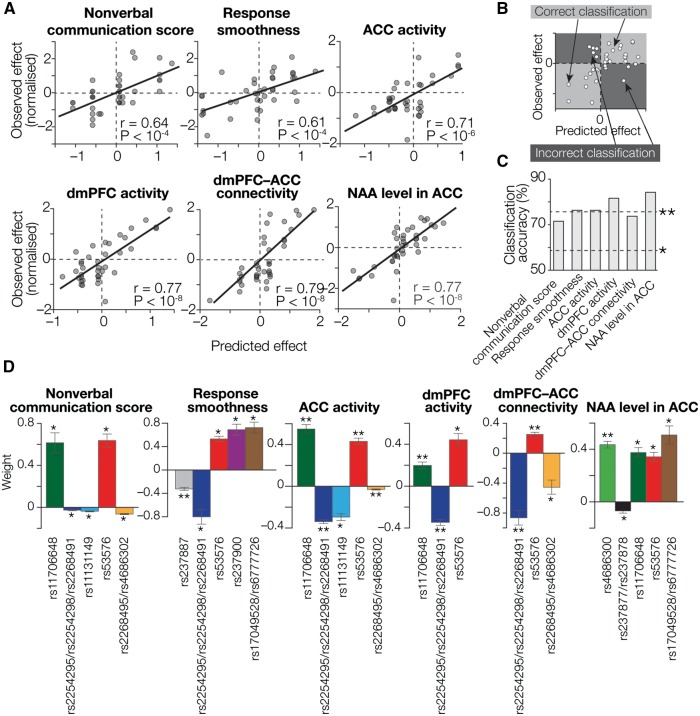
Fig. 3.
Prediction of oxytocin efficacy based on OXTR SNPs. (A) Regression accuracy. The X axes show predicted oxytocin efficacy calculated by SVR using the most informative SNP sets (colored SNPs in Figure 2C), whereas the Y axes show normalized values of the empirically observed effects. Each circle represents a participant. For all the oxytocin effects, we observed significantly high correlations between the predicted and empirical values (PBonferroni-corrected < 0.05; Supplementary Table S2). To reduce the effect of outliers, all the indices of oxytocin efficacy were normalized prior to the regression analysis. (B, C) Based on these regression analyses, we calculated accuracy of this machine-learning technique for classifying participants into an oxytocin-responsive group and a relatively irresponsive group. As schematically shown in panel B, participants plotted in the light gray areas are regarded as correctly classified ones, whereas those in the dark gray areas are not. For all six types of oxytocin efficacy, the classification accuracy was significantly higher (*PBonferroni-corrected < 0.05; **PBonferroni-corrected < 0.01 in binominal tests; panel C). (D) Weight values assigned to the informative SNPs. We examined the weight values assigned to the informative SNPs by the SVR analyses. The Y axes represent weight values averaged across four independent SVR calculations using four independent datasets. Notably, all the informative SNPs show consistent directions across different types of oxytocin efficacy (e.g. weights assigned to rs53576 are significantly positive in all the responses). *PBonferroni-corrected < 0.05; **PBonferroni-corrected < 0.01, in one-sample t-tests. Error bars, SEM. See also Table 2.

