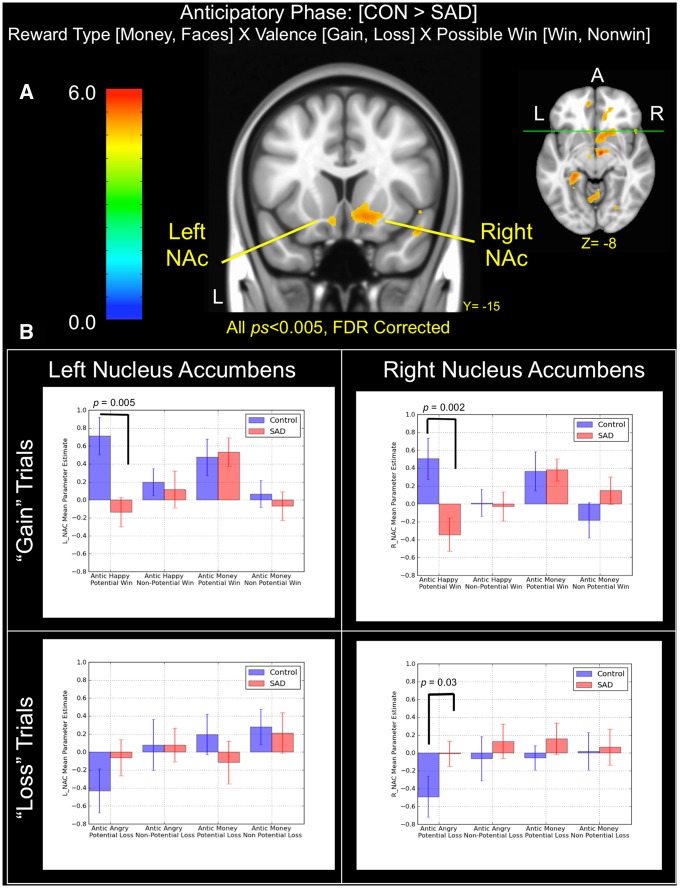
Fig. 4.
(A) Brain areas showing significant group (SAD, control) × reward type (money, faces) × valence (gain, loss) × possible win (win, non-win) interactions during the anticipatory phase of the task. (B) Bar graphs depict mean parameter estimates (±1 standard error) by group and trial types in left and right NAc clusters. Note that all results displayed were thresholded at P < 0.005 and FDR corrected at P < 0.05.

