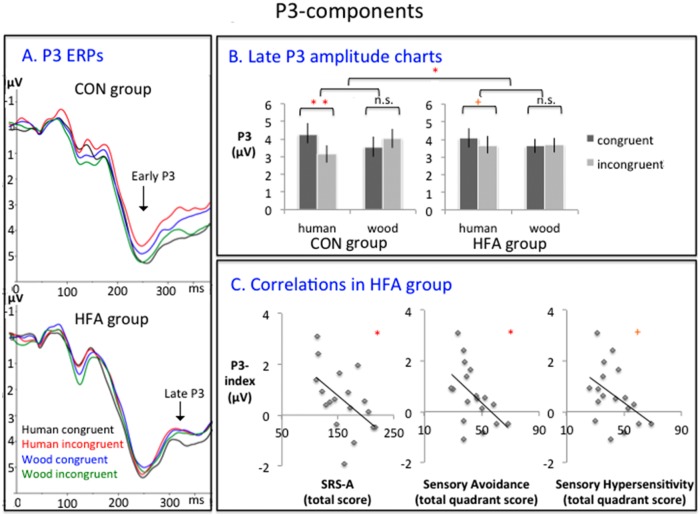
Fig. 4.
P3 components. (A) P3 ERPs, pooled per group and per condition over electrodes Cz, CPz, Pz (upper: CON; lower: HFA). (B) late P3 amplitude charts. (left: CON; right: HFA; error bars denote standard errors; ** p < 0.01; * p < 0.05; +p < 0.10). (C) Correlations of the P3-index in the HFA group with respectively the SRS-A (left), the Sensory Avoidance subscale of the Sensory Profile-NL (middle) and the Sensory Hypersensitivity subscale of the Sensory Profile-NL (right) (regression lines are noted; * p < 0.05; +p < 0.10).

