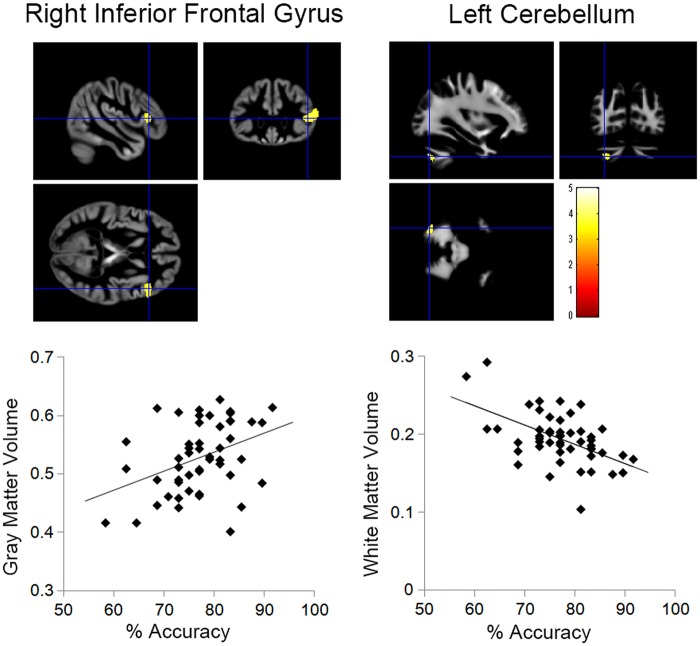
Fig. 1.
Gray and white matter regions showing positive or negative relationships with the recognition accuracy of overall facial expressions. For display purposes, voxels are included above a threshold of P < 0.001 (uncorrected), with an extent threshold of 100 contiguous voxels. The positive correlation between overall emotion recognition and gray matter volume of the right inferior frontal gyrus was significant in the ROI analysis with an FWE correction for multiple comparisons. The blue cross indicates the location of the peak voxel. The red–white color scale represents the T-value. Scatter plots show the gray matter volume of the right inferior frontal gyrus (left bottom) and white matter volume of the left cerebellum (right bottom) as functions of the recognition accuracy of overall facial expressions at the peak voxels.

