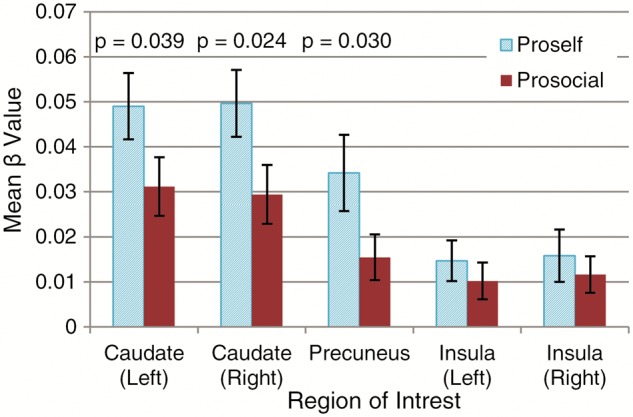
Fig. 5.

Parameter estimates for brain activation modulated by trial number during the decision phase in five ROI’s. Error bars represent SEM. P values of t-tests reveal significant differences in activation between the prosocial and the proself group in the caudate and the precuneus, but not in the insula.
