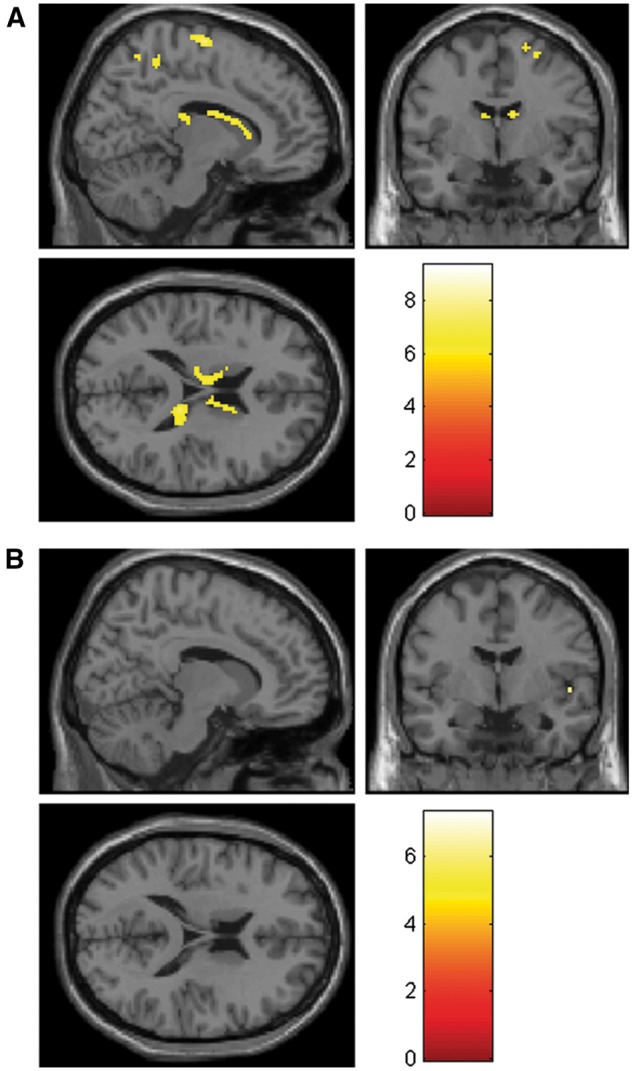
Fig. 6.

Whole brain analysis showing activation (in sagittal, coronal and transverse section; x = 12, y = −4, z = 18) modulated by the trial number during the decision phase for (A) 19 proselfs and (B) 18 prosocials. T value cutoff = 5.81 (corresponding to an FWE corrected P value = 0.05).
