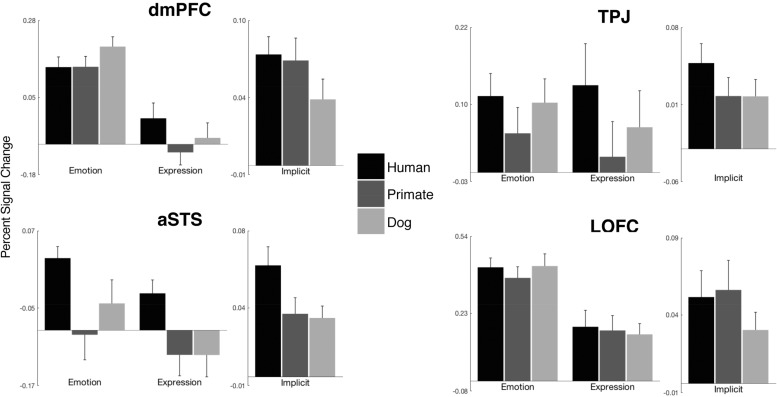
Fig. 2.
Percent signal change in a priori ROIs. For each ROI, the leftmost set of bars represent the mean response across voxels (relative to fixation baseline) to the six conditions of the Explicit Task; the rightmost set of bars represent the mean response across voxels to each target in the Implicit Task (relative to the response to the scramble stimulus condition). For further details on the ROIs, see the main text and Supplementary Table S1. Statistical tests corresponding to the data plotted here are presented in Tables 3 and 4. OFC, orbitofrontal cortex; TPJ, temporoparietal junction; aSTS, anterior superior temporal sulcus; dmPFC, dorsomedial prefrontal cortex.

