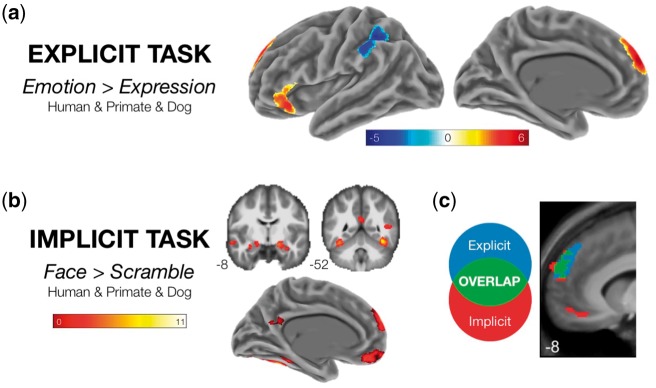
Fig. 3.
Whole-brain analysis of target-independent effects. Statistical maps are cluster-level corrected at a FWE rate of 0.05. (a) ‘Explicit Task’. Regions showing significantly positive or negative responses in the ‘Emotion > Expression’ contrast for all targets. (b) ‘Implicit Task’. Regions showing a significantly positive response in the ‘Face > Scramble’ contrast for all targets. (c) ‘Explicit/Implicit Task Conjunction’. The region of dorsomedial prefrontal cortex showing a target independent-effect in both tasks.

