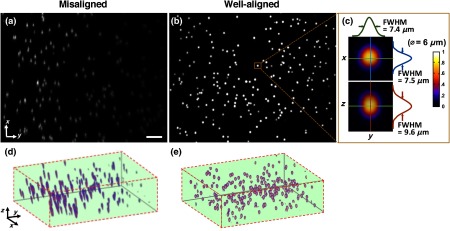
Fig. 4.
(a) A maximum-intensity depth projection (along the axis) of a volumetric image of the alignment phantom is shown for a misaligned LS-DAC microscope. (b) A maximum intensity projection of a volumetric image of the phantom (Video 1) is shown from a well-aligned system in which the intensity of the fluorescent beads is uniform across the FOV with deviation (center to edge) and all beads are well-resolved across the entire FOV of () by () by () (Video 1, MPEG, 2.6 MB [URL: http://dx.doi.org/10.1117/1.JBO.22.4.046005.1]). (c) Example cross-sectional views of one bead. The FWHM dimensions of the microsphere allow for the assessment of the spatial resolution of the system. (d, e) Alpha-blending volume renderings of (a and b), respectively, illustrate the uniformity of the detected fluorescence signal from the beads as well as the uniformity of the spatial resolution across the entire FOV. The scale bar represents .

