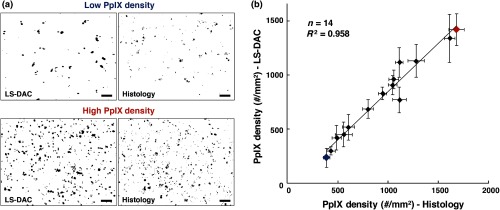
Fig. 5.
Quantitative comparison of LS-DAC microscopy images versus corresponding fluorescence histology images in terms of PpIX density. (a) Representative binary images of two of the biopsy samples, one with low PpIX density (blue) and the other with high PpIX density (red). (b) Scatter plot of all 14 glioma specimens obtained over 15 months. Each point on the scatter plot represents the average PpIX density at three randomly chosen locations within each biopsy sample, with the error bars indicating the standard deviation from the measurements. Note that a volumetric dataset (Video 2) was collected at each tissue location, but only a optical section at the surface was quantified to simulate a slide-mounted histology section. The scale bars represent . (Video 2, MPEG, 1.4 MB [URL: http://dx.doi.org/10.1117/1.JBO.22.4.046005.2]).

