Figure 2.

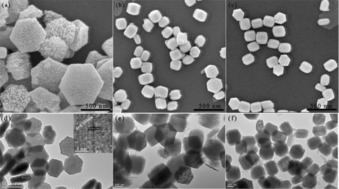
a–c) SEM images of o‐W18O49, n‐W18O49, and r‐W18O49, respectively. d–f) TEM images of o‐W18O49, n‐W18O49, and r‐W18O49, respectively. The inset in (d) is the HRTEM image of the position marked in red.

a–c) SEM images of o‐W18O49, n‐W18O49, and r‐W18O49, respectively. d–f) TEM images of o‐W18O49, n‐W18O49, and r‐W18O49, respectively. The inset in (d) is the HRTEM image of the position marked in red.