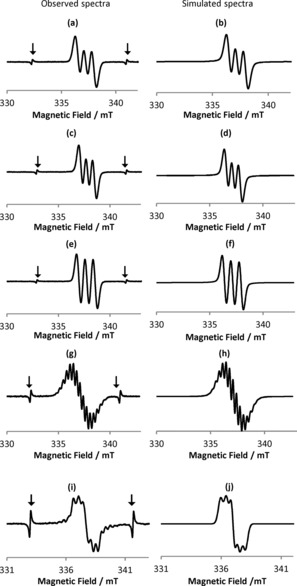
Figure 3.

Observed EPR spectra of a) 1, c) 2, e) 3, and g) 4 with 1 equivalent of MB, as well as that of i) 4 with 3 equivalents of MB; the spectra in panels b, d, f, h, and j are the corresponding simulated spectra. Signals marked with arrows in panels a, c, e, g, and i represent the Mn2+ marker.
