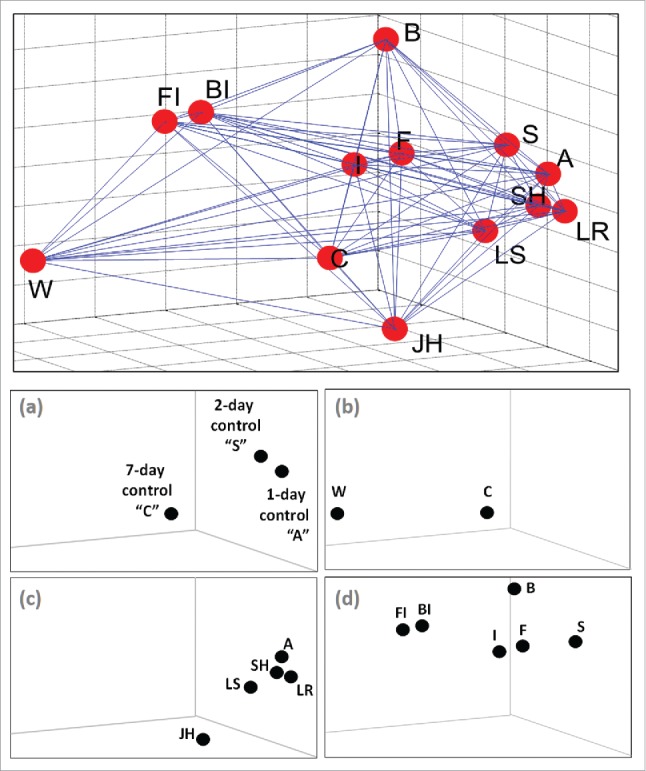
Figure 3.

Topology profiles based on a Euclidian distance analyses of normalized microarray data. Top: A 3-dimensional plot of all data. Bottom: (a) control treatments, (b) diet/nutritional treatments, (c) hormonal/social treatments, (d) xenobiotic/immunological treatments. Abbreviations: S, DMSO solvent control; A, acetone control; C, cellulose paper; W, pine wood; JH, juvenile hormone; LS, live soldiers; SH, soldier head extract; LR, live reproductives; F, fungi; B, bacteria; I, imidacloprid; FI, fungi+imidacloprid; BI, bacteria+imidacloprid.
