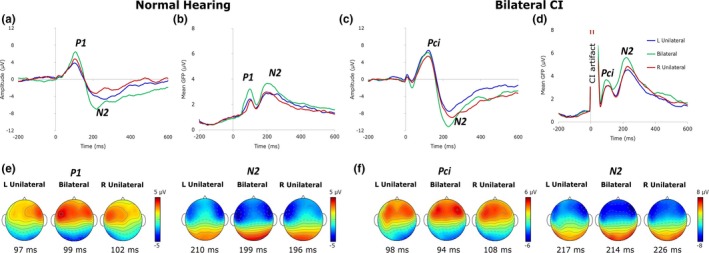
Figure 2.

Grand average Cz waveforms and global field power (GFP) in normal hearing children (a, b) and children with bilateral CIs (c, d) to unilateral and bilateral conditions demonstrate immature responses in both groups. (e, f) display average topographic maps at response peaks for P1/Pci and N2 in children with normal hearing and bilateral CIs, respectively. The change between conditions at P1 in children with normal hearing (e) was more distinct than in children with CI (Pci; f). Distribution of EEG activity at N2 was similar in both groups
