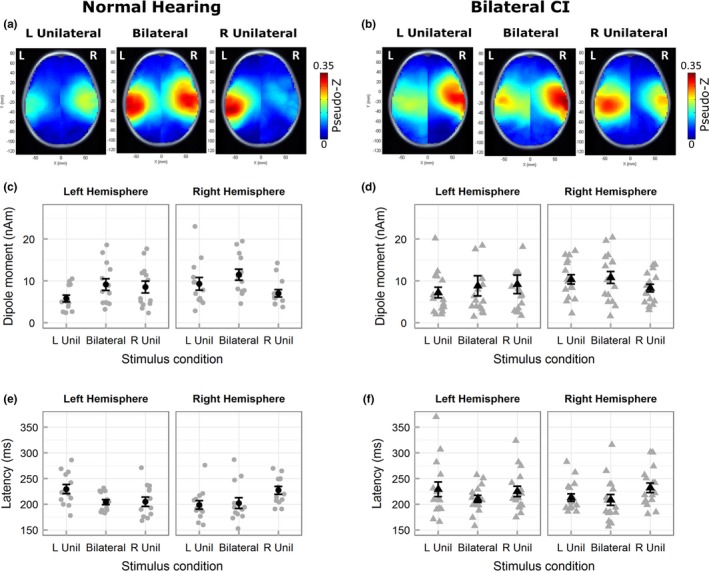
Figure 4.

Mean pseudo‐Z maps (axial images) in children with normal hearing (a) and bilateral CIs (b) display similar predominant contralateral activated cortical regions during unilateral stimulation. Peak dipole moment (c, d, mean in black and individual in gray) and peak latency (e, f) illustrate a similar pattern of lower dipole moment and longer latencies for ipsilateral relative to contralateral and bilateral stimulation in both groups. Error bars represent SE. Abbreviations L Unil and R Unil represent left‐unilateral and right‐unilateral conditions, respectively
