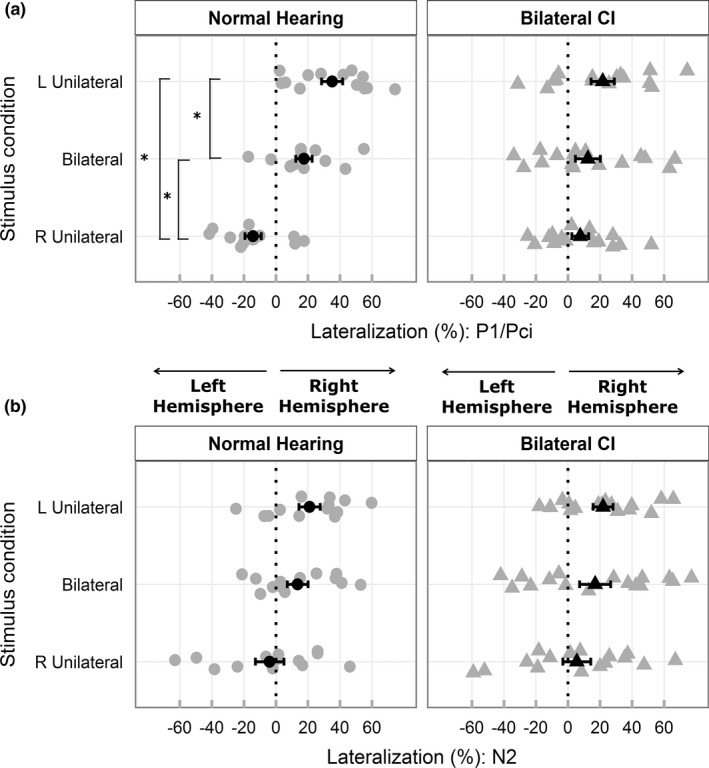
Figure 5.

(a, b) display mean (black) and individual (gray) cortical lateralization indices (%) for response peaks P1/Pci and N2, respectively. A significant (indicated by *) progressive increase in cortical lateralization toward the right hemisphere going from right to left unilateral stimulation is evident only in children with normal hearing during P1. Cortical lateralization patterns in N2 resemble that of P1 and are similar between the two groups. Error bars represent SE
