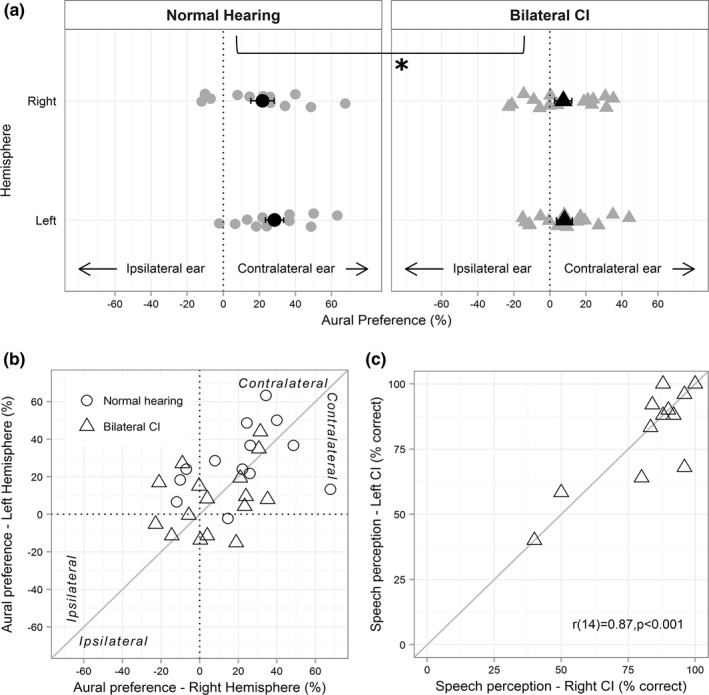
Figure 6.

(a) Individual (gray) and group mean (black) aural preference in children with normal hearing and bilateral CIs indicate contralateral aural preference in both groups however significantly lower scores in bilateral CI users (* indicates a significant main effect of group, when averaged across both hemispheres). Error bars represent SE. (b) illustrates the symmetry in aural preference of the left and right hemisphere with greater variability in bilateral CI users. (c) illustrates the positive correlation between the right and left CI speech scores
