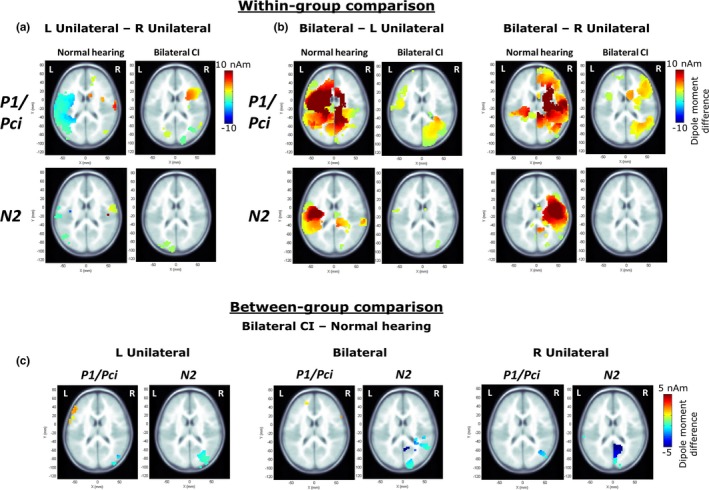
Figure 7.

(a and b) plot the voxels showing significant differences in dipole moment between unilateral conditions, and bilateral and unilateral conditions evaluated within each group for each response peak (P1/Pci, N2) using 10000 permutations (corrected for multiple comparisons using a Bonferroni correction; p = .05/62 = 0.0008; Jiwani et al., 2016). Only axial images are shown. Hotter colors indicate greater activity in the left‐unilateral condition in (a) and in the bilateral condition in (b). Children with bilateral CIs show fewer differences than children with normal hearing (a, b) and greater activity in the occipital lobe when bilateral conditions are contrasted with unilateral conditions (b). (c) illustrates between‐group differences; hotter colors in the left frontal lobe indicate significantly higher dipole moment in the CI group and cooler colors in the inferior parieto‐occipital regions indicate significantly higher dipole moment in the normal hearing group
