
Figure 1.
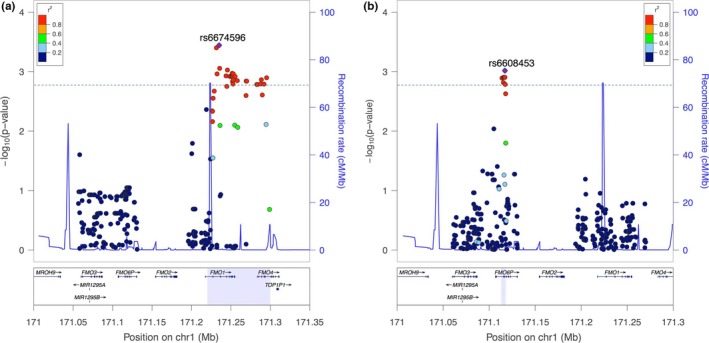
Regional association plots of FMO1–FMO3–FMO6P genomic region based on (a) European Americans and (b) African Americans. The blue dash lines are the −log10 (p‐value) threshold used in our study(1.25 × 10⁻³)
Official websites use .gov
A
.gov website belongs to an official
government organization in the United States.
Secure .gov websites use HTTPS
A lock (
) or https:// means you've safely
connected to the .gov website. Share sensitive
information only on official, secure websites.
Regional association plots of FMO1–FMO3–FMO6P genomic region based on (a) European Americans and (b) African Americans. The blue dash lines are the −log10 (p‐value) threshold used in our study(1.25 × 10⁻³)