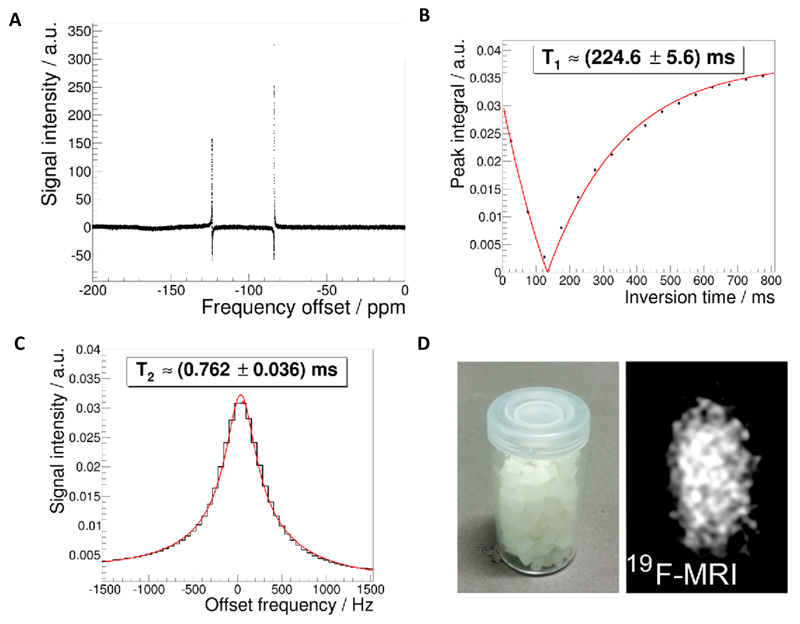
Figure 3.
MRI characterization of 19F-TPU. A: 19F-NMR spectra of the polymeric solution with deuterated chloroform as solvent, recorded using a Bruker DPX-400 FT-NMR spectrometer at 376.5 MHz. B-C: T1 and T2 measurements. Please note that only the strongest 19F-peak has been used for imaging due to the large spectral separation (~40 ppm) of the two 19F peaks (A) and acquisition bandwidth of 8 kHz of the clinical 3T MRI scanner. D: 19F MR imaging of 19F-TPU polymeric pellets in a 3T scanner using an UTE sequence.

