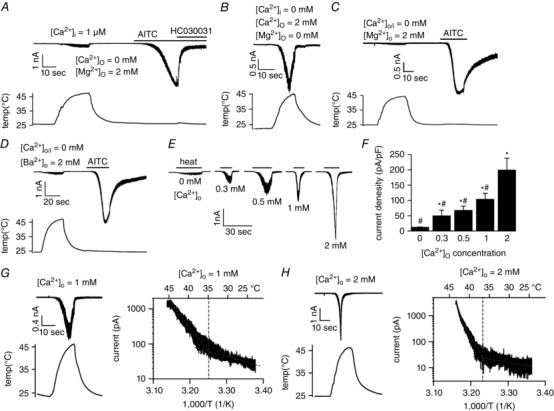
Figure 1. Heat‐evoked gaTRPA1 currents in HEK293T cells in the absence and presence of extracellular Ca2+ .

A, representative current (upper) and temperature (lower) traces in response to heat or AITC (400 μm) stimulation in the absence of extracellular Ca2+ in HEK293T cells expressing gaTRPA1. HC030031 (50 μm) was added after AITC stimulation. The pipette solution included 1 μm intracellular free Ca2+. B, representative current (upper) and temperature (lower) traces in the absence of extracellular Mg2+ with extracellular Ca2+ (2 mm) in HEK293T cells expressing gaTRPA1. C, representative current (upper) and temperature (lower) traces for heat and AITC (400 μm) stimulation in the absence of extracellular and intracellular Ca2+. D, representative current (upper) and temperature (lower) traces in response to heat or AITC (400 μm) simulation in the presence of extracellular Ba2+ (2 mm) and absence of extracellular Ca2+ in HEK293T cells expressing gaTRPA1. E, representative gaTRPA1‐mediated heat‐evoked whole‐cell current traces. Lines above the traces show heat stimulation duration. Extracellular Ca2+ concentrations ([Ca2+]o) are shown below the traces. F, heat‐evoked gaTRPA1 current densities at different extracellular Ca2+ concentrations. G and H, representative current (upper) and temperature (lower) traces for gaTRPA1 at 1 mm (G, left) and 2 mm (H, left) extracellular Ca2+, and Arrhenius plots of currents elicited by heat stimulation from 25°C at 1 mm (G, right) and 2 mm (H, right) extracellular Ca2+. Data represent means plus/minus S.E.M. (n = 5–8). * P < 0.05 vs. 0 mm; # P < 0.05 vs. 2 mm.
