
Figure 7. Identification of amino acid residues involved in LPA‐induced TRPA1 activation.
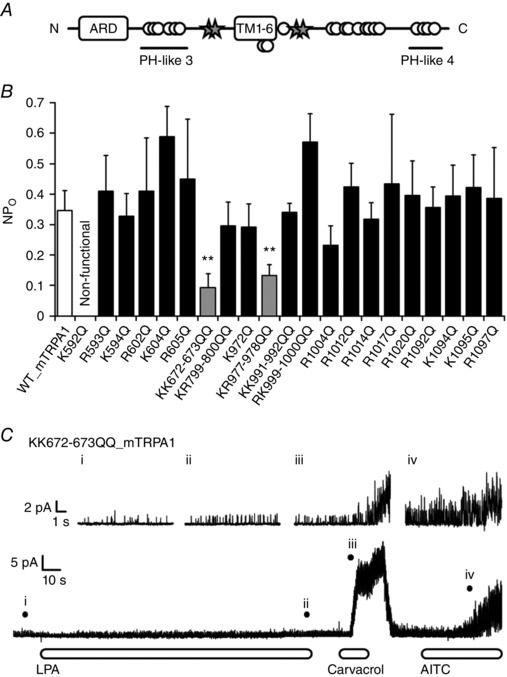
A, schematic diagram of the mTRPA1 structure. ARD, ankyrin repeat domains; PH‐like 3 and 4, pleckstrin homology‐like domain 3 and 4; TM, transmembrane domains. Open circles and stars indicate mutated amino acids; four amino acids (stars) were found to be involved in LPA activity. B, comparison of NPo values of WT and mutated mTRPA1 upon LPA (5 μm) application from inside‐out single‐channel recordings; n = 3–13. ** P < 0.01 vs. WT by Welch t test. Data are shown as mean ± SEM. C, representative single‐channel recordings obtained from the KK672‐673QQ mTRPA1 mutant‐expressing patches upon sequential application of LPA (5 μm), carvacrol (500 μm) and AITC (100 μm). Each magnified current in the upper trace corresponds to currents at points i–iv indicated with filled circles in the lower trace; n ≥ 3.