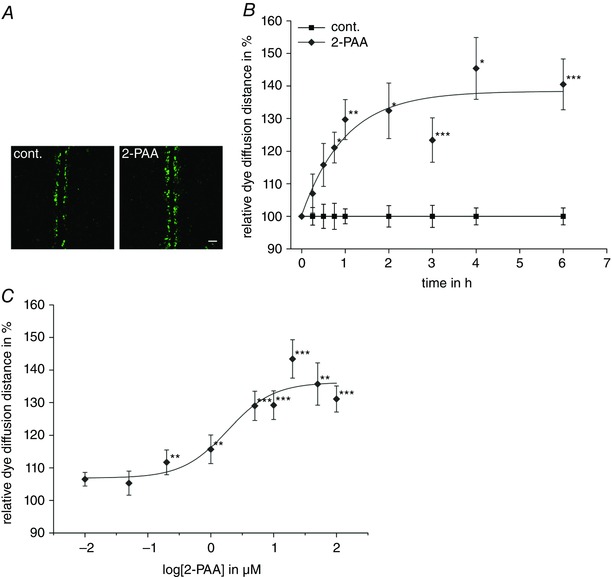
Figure 2. Enhancement of gap junction coupling by 2‐PAA.

A, representative micrographs of scrape loading/dye transfer experiments in hCMEC/D3 cells treated with the vehicle (cont., 0.3% ethanol) or 2‐PAA (20 μm) for 1 h. Scale bar represents 100 μm. B, the time‐dependent increase in the dye diffusion distance induced by 2‐PAA (20 μm) as found by scrape loading/dye transfer assays relative to the vehicle control (cont., 0.3% ethanol). C, the concentration dependency of 2‐PAA on the increased dye diffusion distance. The data points represent the relative dye diffusion distance achieved in cell monolayers after application of 2‐PAA for 1 h. All results were analysed using Student's t test. *Significant differences to the vehicle control: * P < 0.05, ** P < 0.01, *** P < 0.001. [Color figure can be viewed at wileyonlinelibrary.com]
